Articles
What can I do with my Aerohive captures once they are in CloudShark?
4 min read
By now you’ve signed up for a CloudShark account and probably pushed your first capture from HiveManager NG into your repository. Where do you go from here? What sort of things should you be looking for?
What exactly have I captured?
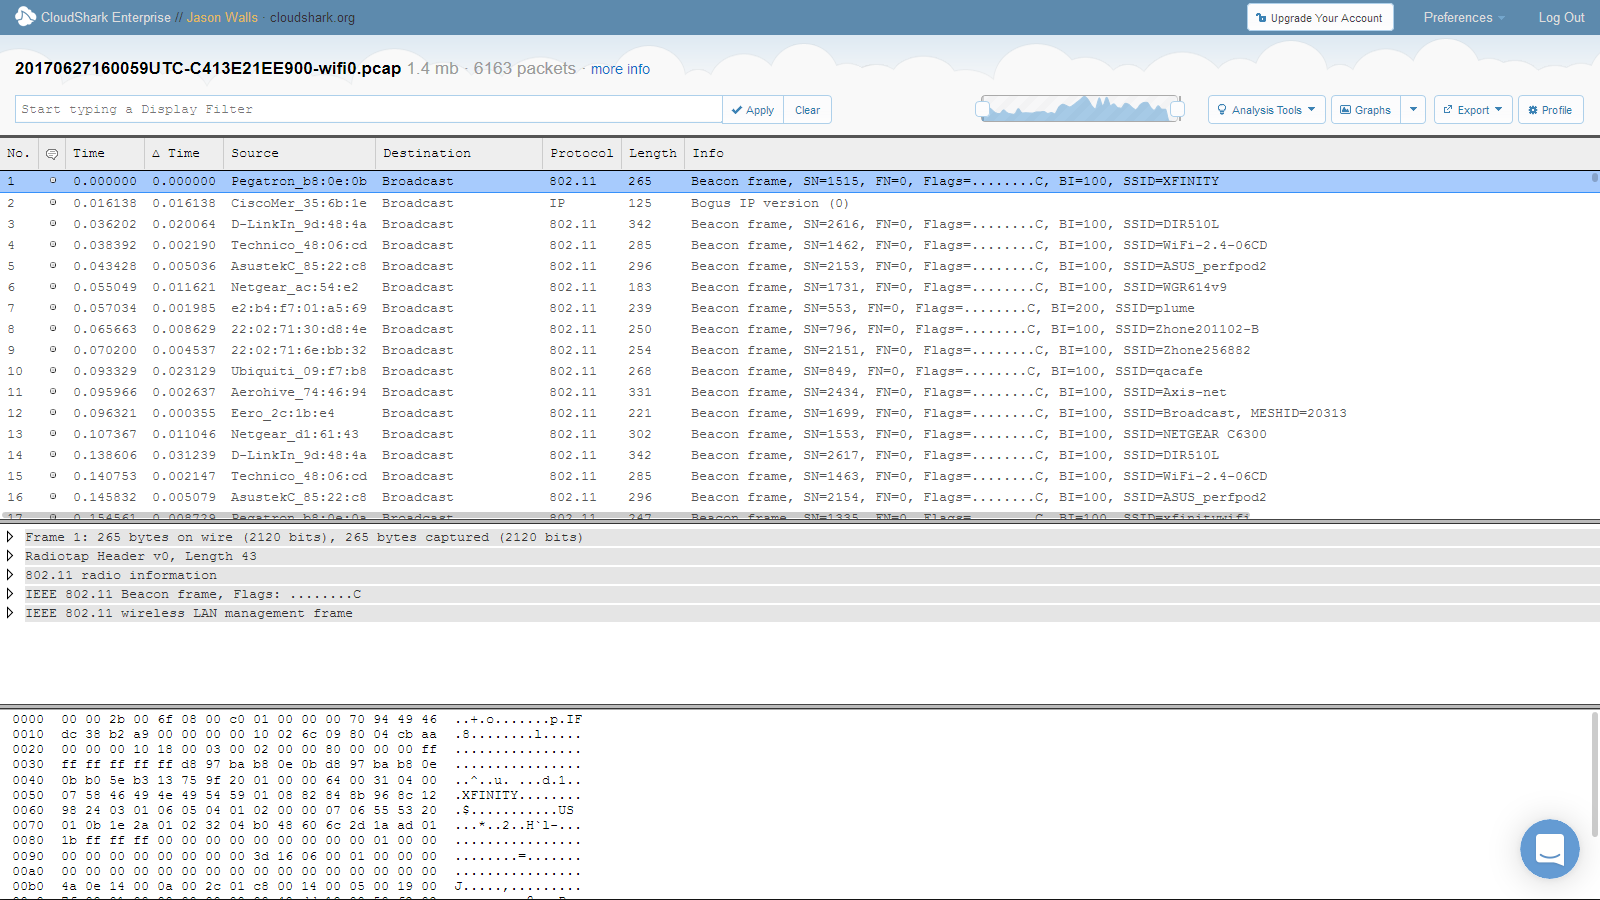
A packet capture file sourced from your Aerohive device contains a record of all network traffic that passed through the interface you chose when doing your capture. In HiveManager NG, if you have captured on a WLAN interface, this will be 802.11 traffic containing Management, Control, and Data frames. The Data frames will contain IP/IPv6 payloads. (Even though your wireless network is encrypted over the air, the Aerohive decrypts them automatically for you in the trace file! We’ll talk about that more in an upcoming article.)
Looking at your first capture
If you click on a capture you’ve made in HiveManager NG, you’ll be taken to the capture view. If you’ve used Wireshark before, this should be a familiar sight, and CloudShark has much of the functionality of Wireshark plus a lot more.

From here, click on the “More Info” button at the top.

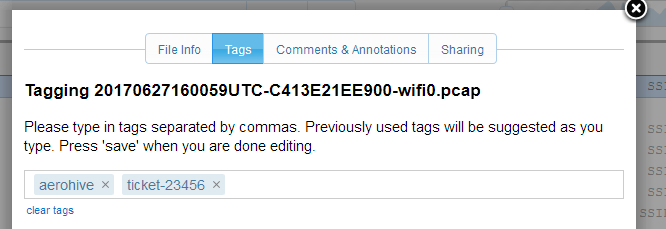
This will open the “More Info” window, which gives you a detailed look at the metadata of the capture file. More importantly, it allows you to add tags and change the sharing settings for your capture.
Adding tags
Adding tags to your capture will make organizing and searching your captures easier. We like to use tags for things like location, trouble ticket numbers, or for examples to look up later.

Sharing a capture
Under the “Sharing” tab you can switch the file from “Not shared” to “Public”. This means that anyone with the URL can view the file. The URL is unique, so it likely won’t be randomly guessed by anyone, but obviously use this with precaution.

When you do share a capture, you can simply copy and paste the URL. What’s even better is that if you add a filter or use any of CloudShark’s analysis tools, it all becomes part of this URL - which lets your colleagues start exactly where you need them to.
Finding the right traffic
Like we said above, HiveManager NG captures on wireless access points are made of 802.11 frames. This can make your capture look confusing at first if you’re trying to find actual IP conversations! Not to worry though, the easiest solution is to make a filter, in this case, “ip”.

This will filter out the 802.11 management frames and let you get to the meat of the network traffic.
Using tools to find the problem
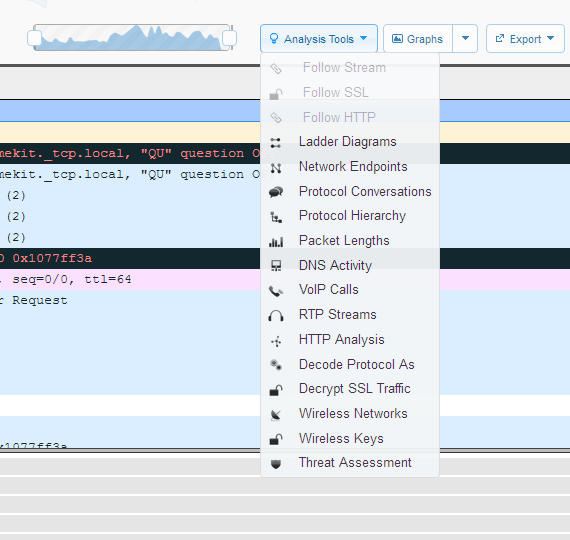
For help drilling down into what’s going on in your capture, use any of CloudShark’s analysis tools. You can find them in the menu in the top right:

Ladder view
What should you look at first? If there’s a user experiencing problems with a service or application, take a look at our ladder view. If you select “endpoints” as your criteria, and find the addresses of the user and the server, you can see if there’s problems like bad or retried connections.
Wireless networks viewer
If you’re trying to troubleshoot a rogue Wifi AP, you can use the wireless networks viewer to see all of the networks that were seen in the capture. This can give you an idea what other SSIDs are being broadcasted in your network.
Protocol conversations
Lastly, for a high level view of the overall goings-on through the interface, protocol conversations is a good place to start. Sometimes you can see right away if there’s something you don’t recognize or is out of place. Or, if you do know what you’re looking for, clicking on a conversation will build you a filter of just those packets.
Adding notes for later
If you see something you want to show someone else, or keep notes for yourself for later, you can add an annotation by clicking on the little dot in each packet row.

The cool thing is that these annotations support markdown syntax so you can even add things like links to other captures inside of your annotations!
All your captures in one place
That’s a lot to take in at once, but take a look at one other thing. When you click on the CloudShark Enterprise logo at the top left of the page, it will take you back to your capture repository. Every capture you upload to your account ends up here. If you’ve added tags, you can see them and search by them here, too. If you want to get fancy, you can even merge captures together from multiple interfaces or APs, and use DeepSearch to find specific traffic even if you don’t know which capture file it happened in.
Learning more
Most of the links we’ve posted here are from our support page, at support.cloudshark.io.
If you can’t find what you’re looking for or have any questions, you can also chat with us in real time! We use Intercom to give users a direct line to our support team. In the meantime, enjoy using CloudShark with your Aerohive devices and happy hunting!
Want articles like this delivered right to your inbox?
No spam, just good networking